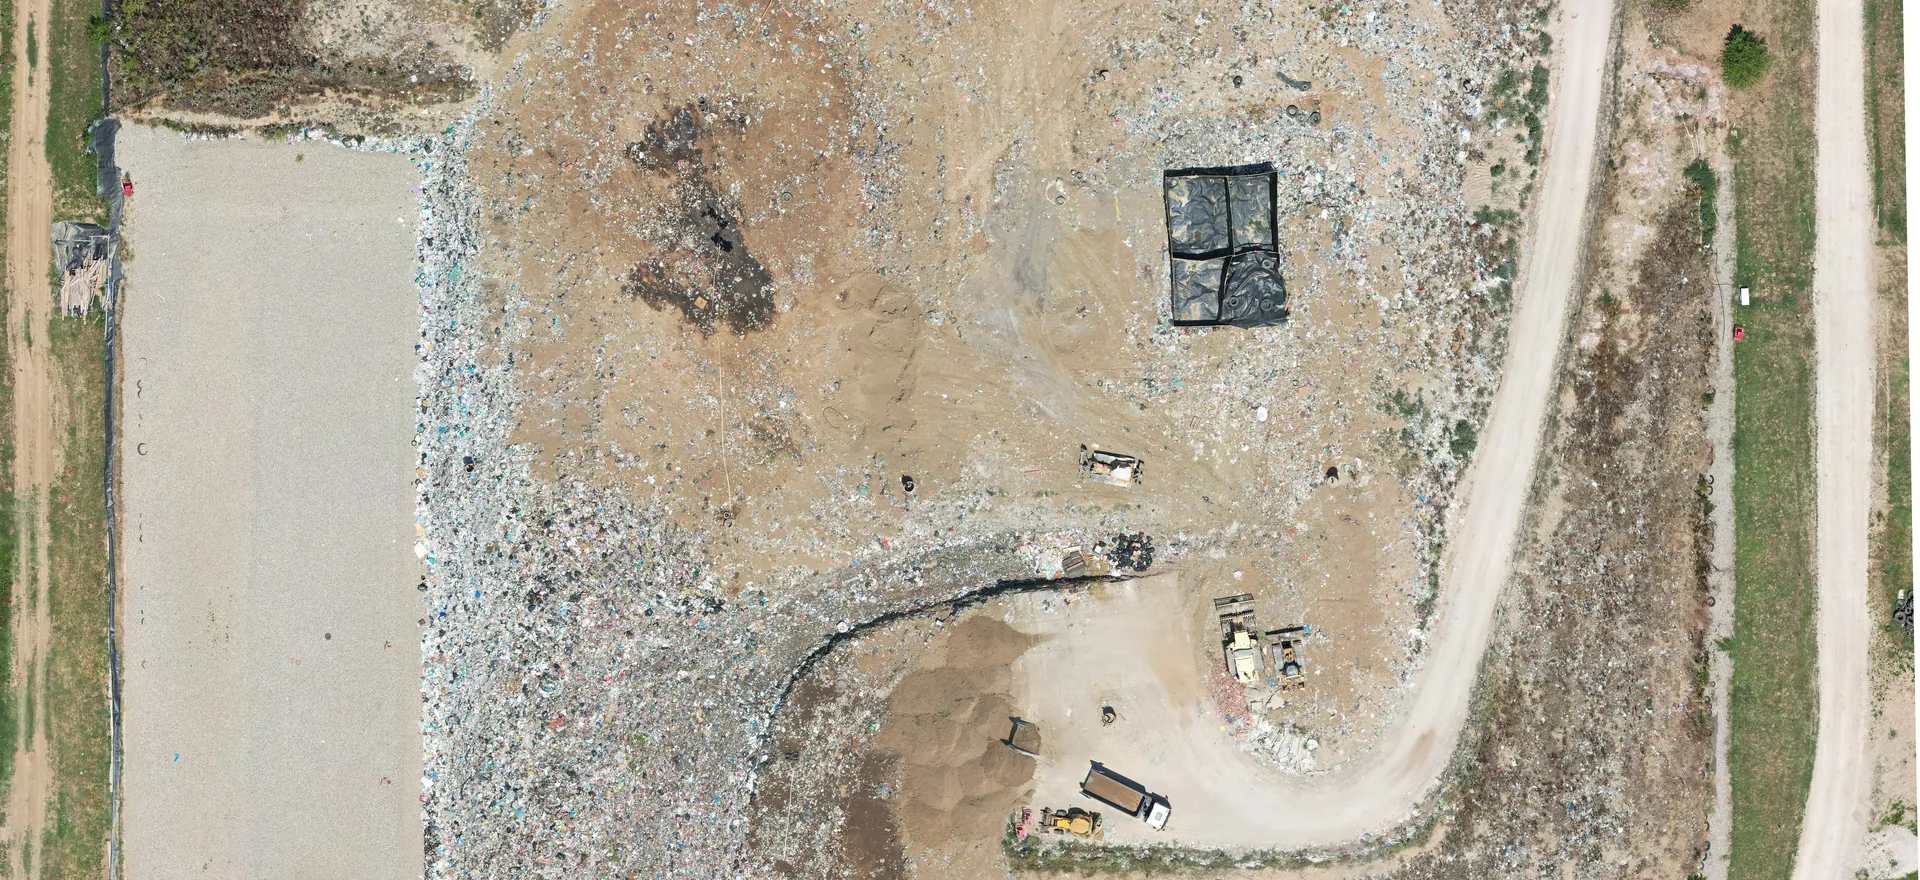
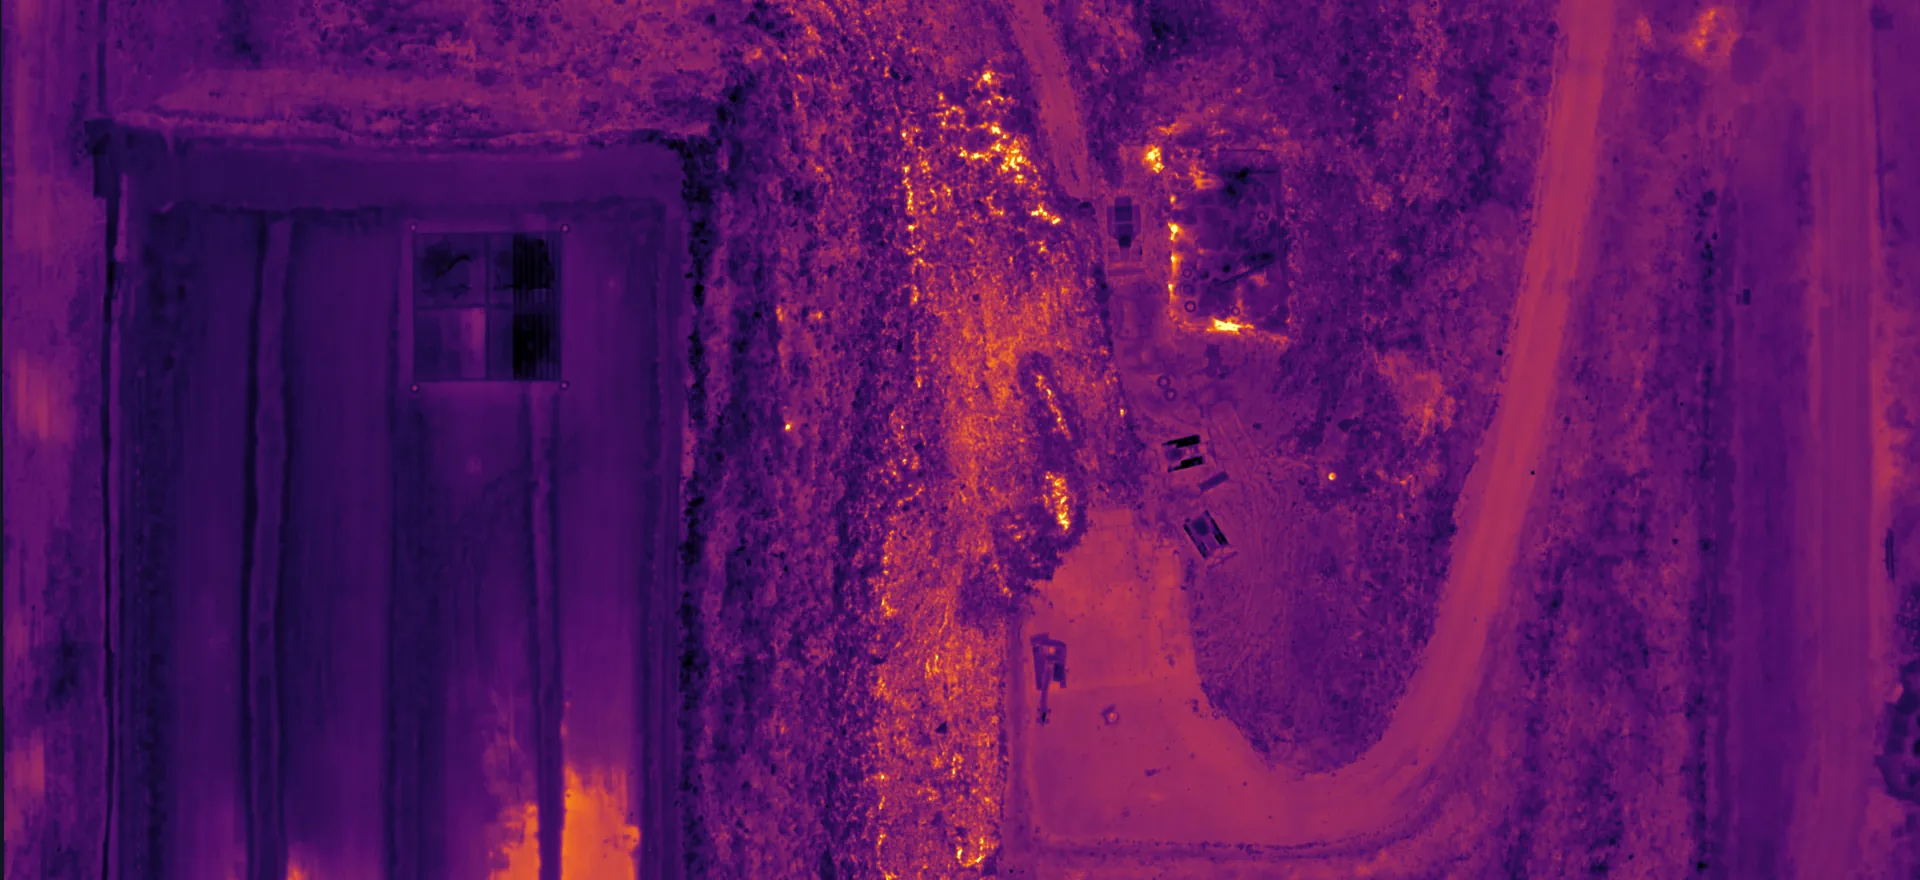
Orthophoto of a landfill with a road, cells and machinery Thermal map of the same landfill, warmer surfaces are lighter orange and yellow Thermal map Orthophoto

Thermal drone surveys

Thermal surveys

Ground temperature on a georeferenced map

A thermal camera on a drone measures surface temperature, pixel by pixel. From hundreds of thermal photos we build one georeferenced thermal map that shows exactly where the ground is warmer than its surroundings, and by how much.

We fly a DJI Mavic 3 Thermal and measure positions with a GNSS RTK receiver. So you get more than a thermal picture: you get a map that lets you find the hot spots on the ground and deal with them.

Request a quote
  • 4 hasurveyed in 45 minutes
  • 8 cm/pxthermal map resolution
  • 114 pointsabove 20 °C picked out on the map
What we deliver

From thermal photos to a finished map

  • Thermal map

    Georeferenced, with a temperature reading in every pixel.

  • Hot spots

    A list of points above a set temperature, with position and reading.

  • Thematic map

    The thermal map to scale, with a legend and the hot spots marked.

  • Orthophoto

    A colour image of the same site, for orientation and comparison.

  • Technical report

    Weather conditions, method, results and recommendations.

  • Repeat surveys

    The same site at intervals, to see whether hot spots spread or cool down.

Projects

From the field

Landfill

Regional sanitary landfill

We surveyed the landfill, about 4 hectares, in September 2025, before sunrise, between 5:30 and 6:15, with no wind. That way the sun had not warmed any surfaces, so the map shows only heat coming from the ground itself.

On the thermal map we picked out 114 points above 20 °C, while the surrounding ground was around 3 °C. The hottest point measured 28.2 °C. For each point we gave its position and temperature, with a recommendation to remediate within 5 metres of it. Warmer spots in a landfill can point to intense waste decomposition or smouldering below the surface.
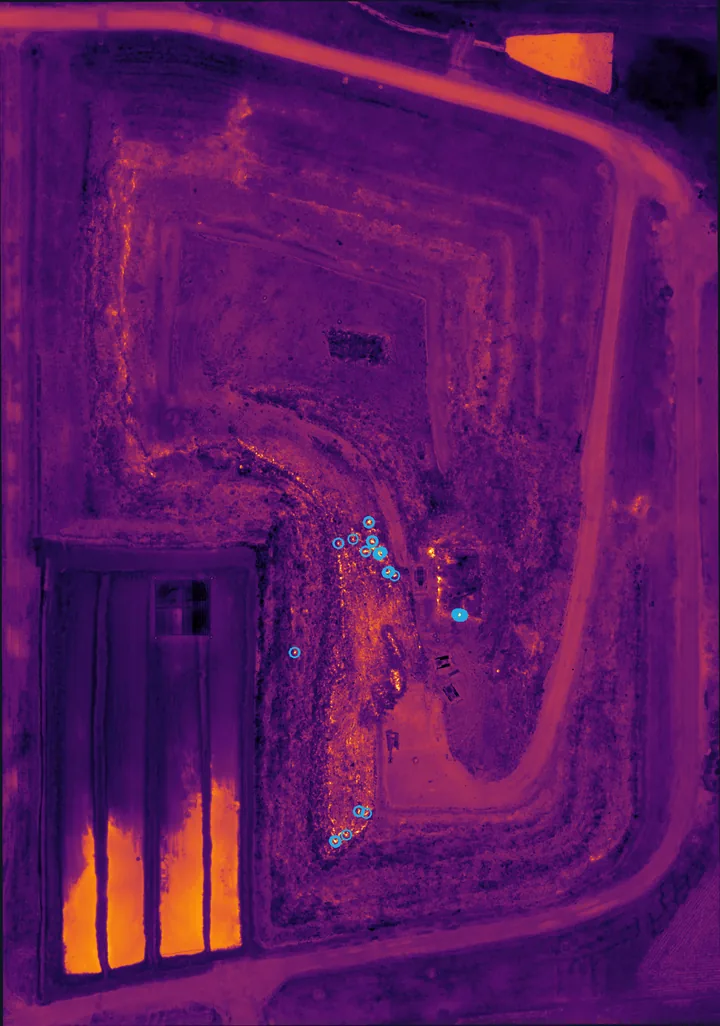
Full thermal map of the landfill, points above 20 °C marked with blue circles
Thermal map, blue circles mark points above 20 °C
Process

How a survey works

  1. Planning

    We pick a time with no sun, wind or rain, usually night or early morning.

  2. Ground control

    We measure control points with a GNSS RTK receiver so the map sits exactly in place.

  3. Flight

    The drone with a thermal camera collects photos along the planned mission.

  4. Processing

    We process the photos in DJI Thermal SDK, Agisoft Metashape and QGIS.

  5. Delivery

    You receive the thermal map, the hot spot list and a technical report.

Flights within the regulationsWe fly in line with the regulations of the Civil Aviation Directorate of the Republic of Serbia. Our operator has passed the Directorate’s air law knowledge test.

FAQ

Questions about thermal surveys

01Why survey at night or early in the morning?

The sun warms different surfaces differently, so in daylight dark materials look hot even when there is no heat source beneath them. Before sunrise, with no wind, the map shows only heat coming from the ground or the structure itself.

02What does a thermal map show?

Surface temperature. It does not see through the ground, but heat rising from below, for example from waste decomposition or smouldering, warms the surface and shows up clearly on the map.

03Where else are thermal surveys used?

Besides landfills: roofs and facades for heat loss, solar plants for faulty panels, district heating pipes and other utilities, and stockpiles of material that can self-ignite.

04What is the resolution of the thermal map?

It depends on flight height. At the landfill shown here one pixel of the thermal map represents about 8 cm on the ground.